Git statistic
Sometime I'm curious to know how many commits I have done in a repository of mine in order to make a graph with my activity or stuff like that; I searched in the interwebz but seems that an out-of-the-box program with a simple command line tool that outputs data to feed tools like gnuplot doesn't exist: I mean, it simple to make git outputs the commit, one for line with only the date
$ git log --format=%ci
2013-12-31 18:10:36 +0100
2013-12-31 18:10:36 +0100
2013-12-31 18:10:36 +0100
This data should be easy to feed gnuplot with, the only problem is if I want to aggregate data grouping by date, like a SQL query; how do that?
I just discovered a simple python command named q that allows to query a text stream with the same syntax of SQL
(under the hood it uses the sqlite3 database): the project is on github and describes itself as
q allows direct SQL-like queries on text files, including joins and any other
SQL construct, and supports automatic detection of column types and names.
Thank to it now I can do a thing like this
 $ git log --no-merges --format=%ct, \
    | q -d , "select strftime('%Y-%m-%d', DATETIME(c1,'unixepoch')) as day, count(*) from - group by day" -D " "
 2011-07-10 1
 2011-07-13 1
 2011-07-14 1
 2011-09-02 3
 2011-09-03 1
 2012-10-16 3
 2012-10-17 3
The DATETIME thing make the database parses correctly the date (note the %ct format string in git log that outputs the unix timestamp).
The final step is to pipe all the data to gnuplot in order to create a wonderful(?) plot
$ git log --no-merges --format=%ct, \
 | q -d , "select strftime('%Y-%m-%d', DATETIME(c1,'unixepoch')) as day, count(*) from - group by day" -D " " \
 | gnuplot -p -e 'set xdata time;set timefmt "%Y-%m-%d" ;set boxwidth 0.9;plot "-" using 1:2 with boxes'
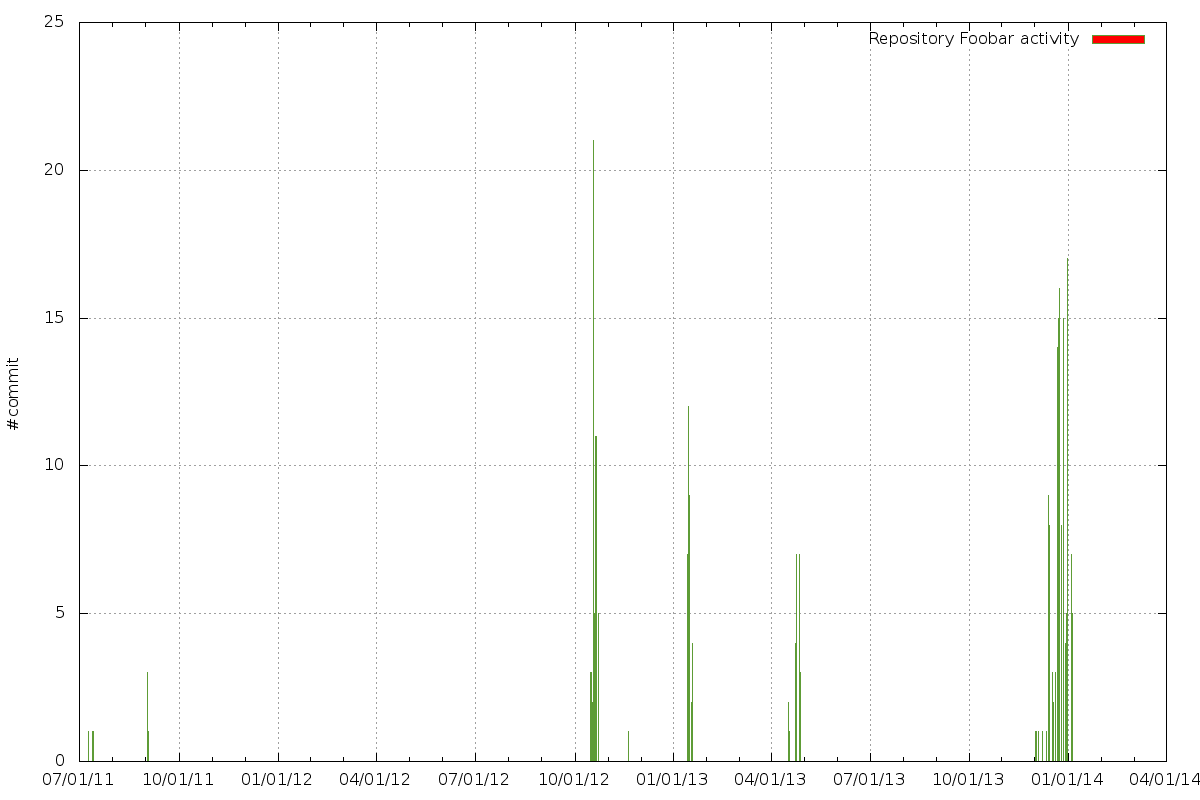
Making a graph with the activity of each author is left as exercise for the reader.
Comments
Comments powered by Disqus